Forecasting The Future – What If?
The future is unknowable, but certain future events are far likelier to occur than alternative events. Forecasting uses historical and contextual data to predict the likelihood of events with the goal of planning for the future. The purpose of forecasting is to make it easier to make decisions today in order to prepare for future events.
- Forecasting facilitates planning.
- What are the options?
- Planning facilitates analysis.
- What are the potential costs, risks and benefits of each option?
- Analysis facilitates decision-‐making.
- Given what we know today, what is the most reasonable course of action?
 Midgard used a univariate, or single variable, model to forecast future electrical energy demand. Univariate modeling has the benefit of being easy to understand and to replicate. The alternative method of a multivariate model is more complicated, more prone to errors, and leads to a false sense of accuracy. Given the long period of time into the future that is being forecast and the fact that uncertainty grows exponentially with this period of time, the univariate model is the best approach.
Midgard’s Rules of Forecasting:
- Forecasting is doomed to be wrong. But the exercise is worthwhile, in terms of the actual process of identifying trends, the maturity of trends, and the alternatives. Many predictions turn out to be more true than not, but the timing is rarely perfect.
- Trends and equilibriums have remarkable staying power. The forces for change have to be substantially greater than the forces supporting the status quo in order to instigate change.
- Discontinuities do happen. But the greater the resistance to change, the greater the shock and disorder when change does arrive.
- Patterns repeat themselves. The best forecasting methodology often seeks out previous and similar scenarios in order to inform forecasts. History does not repeat itself, but it often rhymes.
“It’s tough to make predictions, especially about the future.” Yogi Berra
Building Scenarios
Envisioning Yukon 20-50 Years From Today
In order to determine the need for Next Generation Hydro the technical team had to forecast energy and capacity need 20-50 years from today. They did this by creating three scenarios for electricity use using a top down, single variable model. The chart below details the three scenarios that were explored.
| Low | Baseline | High | |
| Population 2035 | 45,600 | 48,100 | 53,400 |
| Population 2065 | 55,900 | 64,600 | 104,500 |
| Non-Industrial Demand | 9.8MWh/year per capita | 9.8MWh/year per capita | 9.8MWh/year per capita |
| Industrial Demand | – 50 GWh/year – 1 grid connected mine | – 75GWh/year – 1.5 grid connected mines | -100 GWh/year – 2 grid connected mines |
Factors that can impact electricity use
Forecasting electricity use in the future is no simple feat. Many factors can affect how we use electricity from the adoption to electric cars, to changes in energy efficiency regulations. Some factors that can impact electricity use include:
- Climate change impacts
- Technological change
- Regulation and Policy change
- Demographic and population changes
Forecasting is a tool that is used to help plan for the future and minimize risk. If we do not plan today for new hydro we risk having to use a fossil fuel solution.
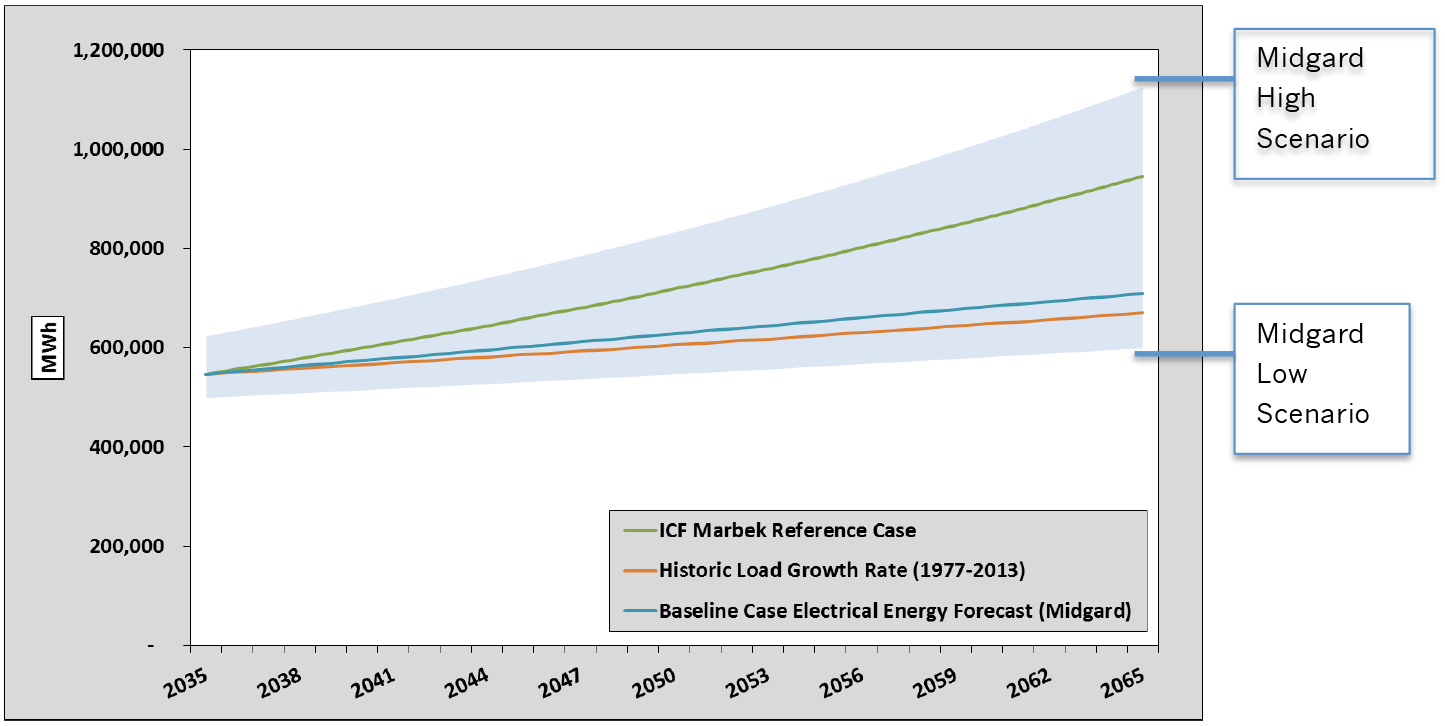
Midgard’s forecast provides high and low scenarios that in turn provide an envelop of plausible future electrical energy consumption over the long-term (the blue zone in the graph below). Figure E-1 below provides different ways of calculating future electricity demand. All three examples fall within the range of Midgards high and low scenarios.
- Example scenario I: The Baseline Case Midgard forecast shows electricity demand if Yukon’s population grows to 64,600 people by 2065 and 1.5 mines are operating by 2031.
- Example scenario II: The ICF Marbek Reference Case shows anticipated electricity demand if 75% of new Yukon housing units use electricity heating for space heating in the future.
- Example scenario III: Yukon’s historic compounded electrical consumption growth rate for the period between 1977 and 2013. This scenarios shows electricity demand if growth continues at the same rate it has in the past.
Figure E-1: Examples of Growth Scenarios (2035-2065) 

